some older perf_event overhead results
The Linux perf_event performance counter interface has more overhead
than previous Linux performance counter interfaces.
Older Overhead Comparison
For newer data see here.
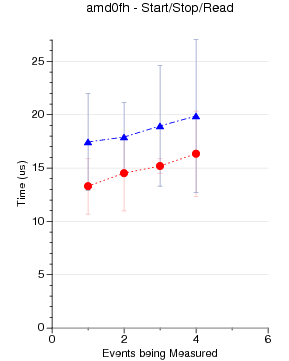
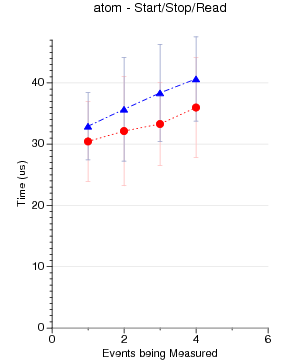
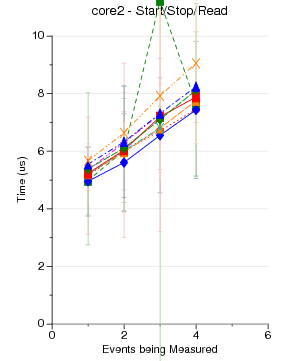
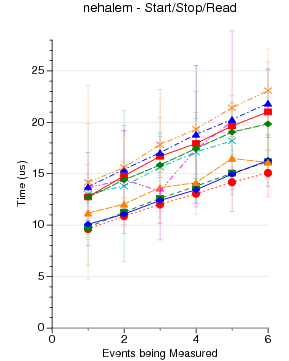
Raw Start/Stop/Read Performance

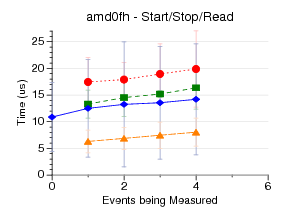
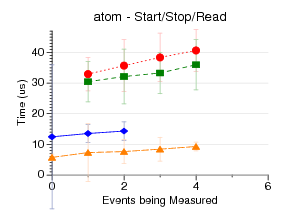
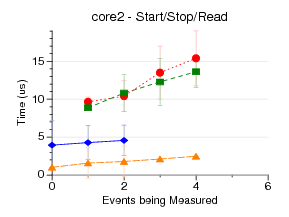
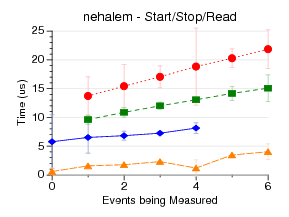
This test measures the latency of doing a start/stop/read
(what you do when self-monitoring) at the lowest level possible.
This means running the syscalls directly when possible.
This does not count initialization of the counter events, etc, only
the start/stop/read. I measure doing this 1024 times, and plot the
results.
perfmon2 has the best results, as its start/stop/read syscalls
are very close to the hardware.
perfctr uses mmap/rdpmc to not
even require a syscall on read; it's surprising its results
aren't better, but this could be due to the *really* crazy
method it has for constructing the arguments to the start/stop ioctl.
I didn't have perfctr setup to handle fixed counters, which
is why it has fewer points on core2/nehalem.
perf_event does a lot more in the kernel, which may be why its results are
worse. I am not sure why things get worse in the move to 3.0, but
there have been a lot of correctness fixes that may take extra time.
Raw Multiple Read Performance
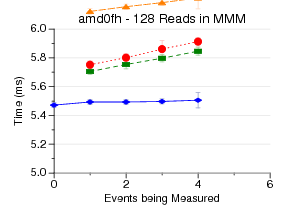
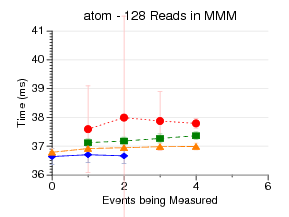
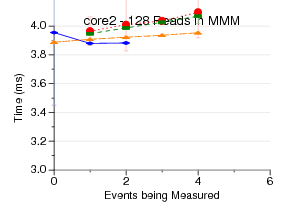
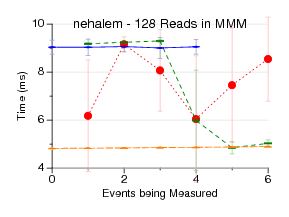
This test measures the latency of doing a start, then
having a read on the outer loop of a 128x128 naive matrix-matrix-multiply,
and then a stop. This means that the read of the performance counters
happens 128 times [the counter results are stored to an array and
printed at the end of the benchmark].
What is graphed is the total time, so the graph is zoomed in so
you just see the overhead.
perfctr often has the best results, due to using rdpmc (no syscall)
when reading results.
perfmon2 is bad on amd0fh?
perf_event has some weird behavior on Nehalem.
Raw Null Perf_Event Performance by Kernel Version

Some PAPI Benchmarks on Various Kernels/Substrates
These are some ongoing experiments to find out what the overhead is
of PAPI on various kernels and substrates. This is an extension
of the work listed above looking at low-level results.

 The variations involved:
- 2.6.32-pe-papi-libpfm4 -- Linux 2.6.32 perf_event with libpfm4.
Various workarounds are enabled in PAPI to work around
perf_event bugs that might slow things down
- 3.0-pe-papi-libpfm3 -- Linux 3.0 and PAPI using libpfm3
- 3.0-pe-papi-libpfm4 -- Linux 3.0 and PAPI using libpfm4
- 2.6.30-perfmon2-papi -- Perfmon2 2.6.30-git and PAPI using libpfm3
- 2.6.32-perfctr-papi -- Perfctr 2.6.42 and Linux 2.6.32 using libpfm3
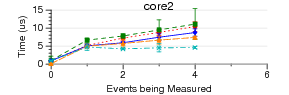
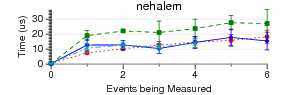
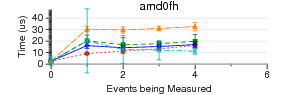
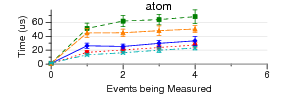
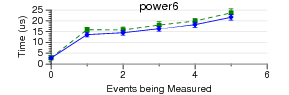
The code run is simple PAPI test code. It generates an EventSet
using 0 - 16 native events. Then POSIX clock_gettime() is used
to measure how long a PAPI_start() PAPI_stop() pair take to execute.
(PAPI_stop() also reads the counter values). There is no code
between the start and stop.
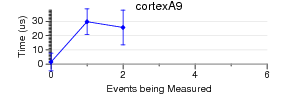
1024 runs are made. The graphs show mean and standard deviation
error bars.
The limited Power6 results are because I don't have the ability
to install new kernels on that machine.
There is no support for ARM Cortex A9 on other kernels/substrates.
To newer overhead measurements