Perf Event Overhead Measurements
Perf Event Overhead Measurements
perf_event / perctr / perfmon2 comparison
As a PAPI developer I am interested in the overhead caused
by using performance counters while self-monitoring code.
The following shows the results of some regression tests run
across a wide range of Linux kernels.
We are still concerned that overhead is still so much
worse than the perfctr and perfmon2 implementations that have
become deprecated since perf_event was introduced in 2.6.31.
Overhead Results
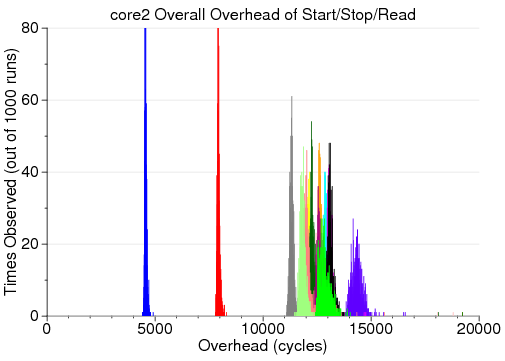
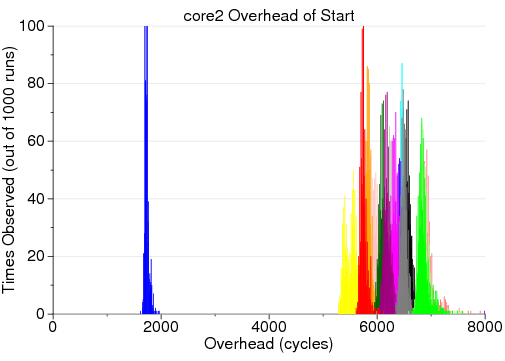
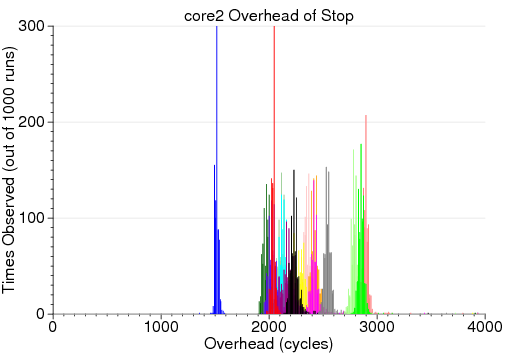
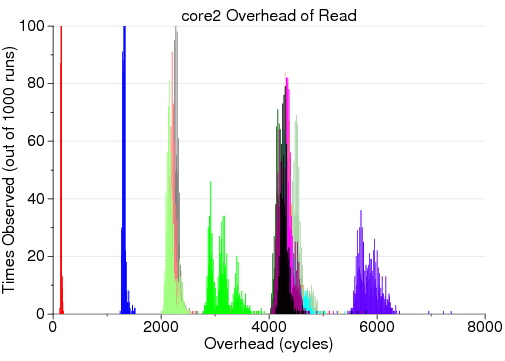
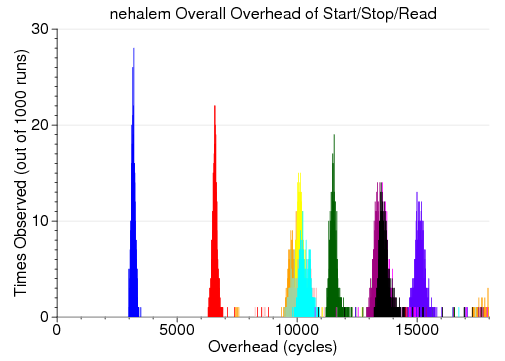
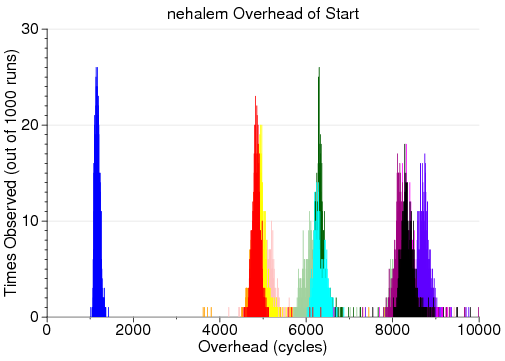
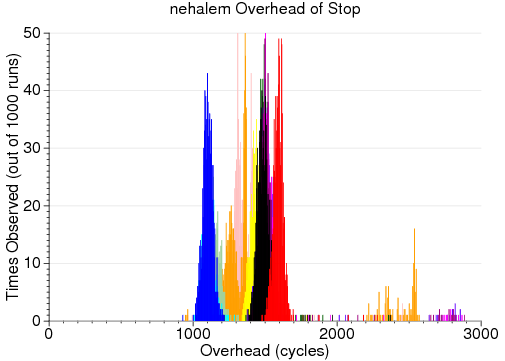
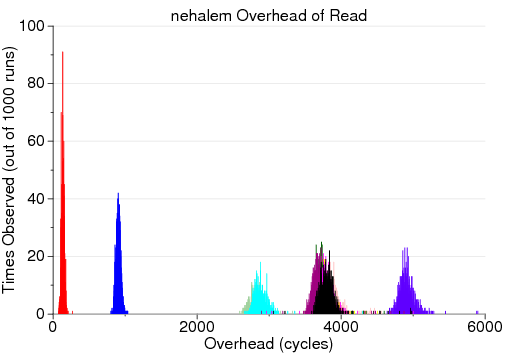
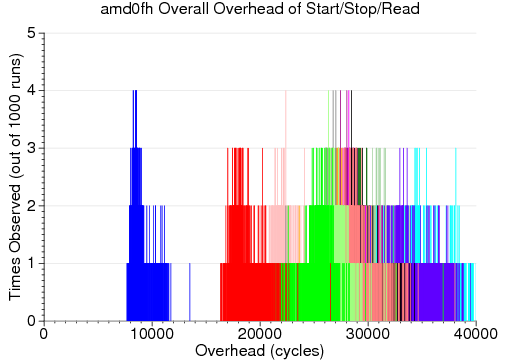
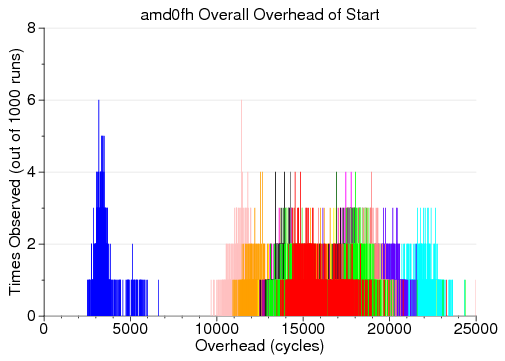
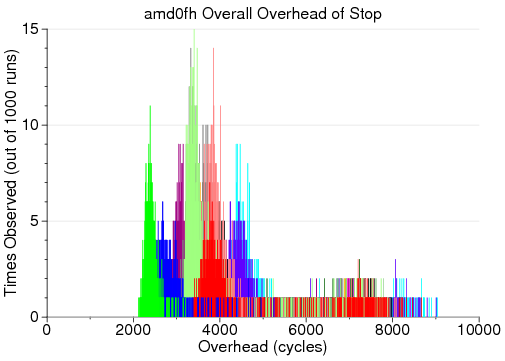
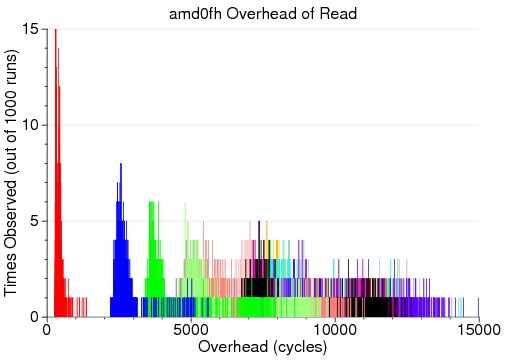
The following shows the overhead of a start/read/stop operation,
with nothing in between.
As can be seen, the perf_event behavior varies with kernel version
but stays relatively consistent. perfmon2 and perfctr overhead
is much lower.
The results also show kernel 3.4 using the new "rdpmc" read counter without
entering kernel support (this is how perfctr gets such low-latency reads).
Oddly on perf_event this often makes the latency *worse* not better.
For more details on methodology and a closer look at the perf_event
results skip to the next section on this page.
| CPU | Total Overhead | Start Overhead | Stop Overhead | Read Overhead |
|---|
| Core2 |

|
|
|
|
|---|
| Nehalem |
|
|
|
|
|---|
| AMD 0fh |
|
|
|
|
|---|
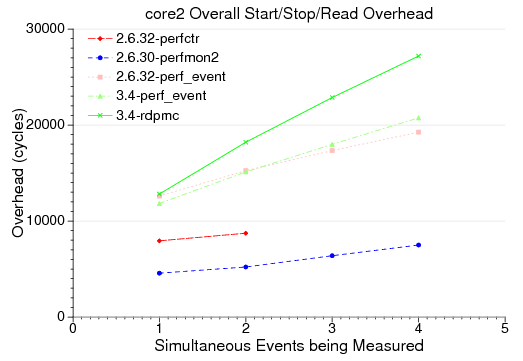
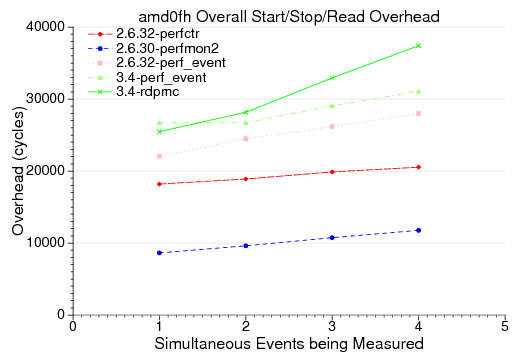
Variation as More Counters are Added
The above results are just for measuring one counter. The below
results show how things increase as more counters are added.
In general they should increase linearly as additional rdmsr/rdpmc
instructions are needed for each additional counter.
Core2:
AMD family 0fh:
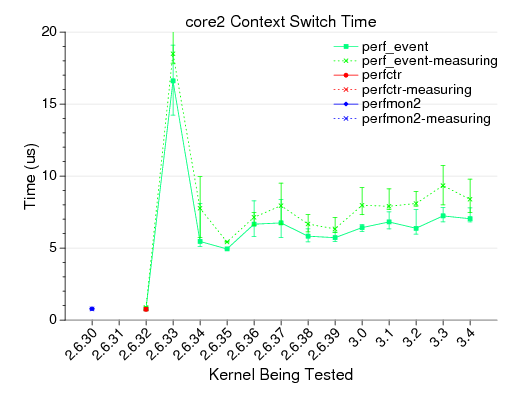
Context Switch
Context switch time with and without a perf counter measurement
running. This was gathered using the lmbench lat_ctx benchmark.
I'm not sure why the time reported varied so drastically from 2.6.30 through
2.6.33.
Methodology
These results are with the CPU scaling governors set
to "performance", the test bound to CPU0, the NMI watchdog disabled,
and the test run 1000 times.
All of the kernels are stock kernels, built with gcc-4.4, using
the following config: CONFIG-STOCK
The code for all of the tests can be found here:
perfevent_overhead-0.14.tar.bz2 (8 August 2012)
The code creates the events in advance, and then measures
the TSC around the start, stop and read calls. Something like:
   start_before=rdtsc();
   ret1=ioctl(fd[0], PERF_EVENT_IOC_ENABLE,0);
   start_after=rdtsc();
The machines involved:
- core2 -- MacBookPro, 3GHz Core2 Duo T9900
- nehalem -- Dell Precision M4500, 2GHz i7 X920
- amd0fh -- HP 5150MT, 2GHz Athlon 64 X2
Back to perf_events benchark page