


Next: Write Performances of the
Up: Experimental Results on Write
Previous: Benchmark
The overall and raw write throughput is measured in CEFT-PVFS with
a configuration of 8 data servers mirroring 8 under two access
patterns: all clients concurrently write different files and all
clients concurrently write different portions of the same file.
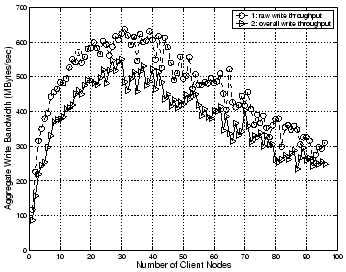
Figure 6 and 7 plot the overall
and raw write performance of Protocol 2 as a function of the
number of client nodes, in which each measurement is repeated 20
times. As the experiment indicates, the aggregate write
performance increases with the number of client nodes and reaches
its maximum values when the cache at the data server side achieves
best utilization. When the client number continues to increase,
the aggregate write performance will decrease since on the data
server side the context-switching overhead among different I/O
requests increases while the benefit of cache decreases. The
aggregate throughput will eventually saturate the disk throughput.
An important observation from these figures is that the
performance gap between overall and raw write throughput does not
increase significantly with the total number of clients. This
implies that the metadata server is most likely not the
performance bottleneck even when that client number is 100, close
to the total available client number of 128 in our cluster.
Experimental results of the other three protocols also show the
same pattern of performance gap between the overall and raw
throughputs. This further validates the claim made in
[10][2] that the metadata server only
introduces insignificant performance degradation and is not the
performance bottleneck in a moderate-size cluster.
Figure 6:
Aggregate write performance when each client writes to
a different file using Synchronous Server Duplication with 8-mirroring-8 data servers
(20 measurements, discarding 5 highest and 5 smallest).
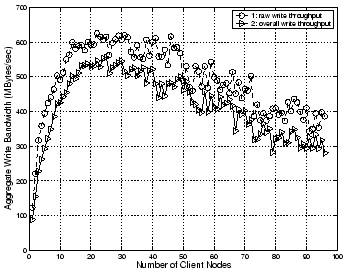 |
Figure 7:
Aggregate write performance when all clients write to the same file
using Synchronous Server Duplication with 8-mirroring-8 data servers
(20 measurements, discarding 5 highest and 5 smallest).
 |
Next: Write Performances of the
Up: Experimental Results on Write
Previous: Benchmark
Yifeng Zhu
2003-10-16