The numerical results, calculated according to the Markov chain model, show the significant impact of the mean-time-to-duplication on the whole system reliability, measured in terms of mean-time-to-data-loss, under different workload conditions. As the model indicates, the reliability of CEFT-PVFS depends on the write frequencies of the client nodes. The more frequently the client nodes write data into the storage nodes, the higher the probability that the primary storage group remains inconsistent with the backup group, thus giving rise to increased likelihood of data loss due to the failure of some nodes in the storage group. The write frequency, measured as mean-time-to-write, is highly dependent on the applications running on the client nodes.
To quantitatively compare the reliability of the four duplication
protocols, we evaluate their reliability in the scenario of a
simple benchmark presented in Section V. Although
this simple benchmark does not reflect all applications that run
on CEFT-PVFS, it gives a quantitative and fair comparison of these
duplication protocols. We recorded the time instants of all the
events on all server and client nodes and stored them into the
files so that we could calculate the ![]() and
and ![]() of this
simple benchmark. The
of this
simple benchmark. The ![]() of Protocol 1 can be directly
calculated from the trace files. The
of Protocol 1 can be directly
calculated from the trace files. The ![]() of Protocol 2 and 4
can be regarded as 0 since the data is consistent as soon as the
client node finishes the write process. To obtain the
of Protocol 2 and 4
can be regarded as 0 since the data is consistent as soon as the
client node finishes the write process. To obtain the ![]() of
Protocol 3 is tricky because the duplication process is performed
by the client nodes. In Protocol 3, we define
of
Protocol 3 is tricky because the duplication process is performed
by the client nodes. In Protocol 3, we define ![]() as the mean
time difference between the arrivals of the acknowledgments from
the primary node and the backup node.
as the mean
time difference between the arrivals of the acknowledgments from
the primary node and the backup node.
We assume that
![]() ,
,
![]() and
and
![]() . In the simple benchmark,
. In the simple benchmark,
![]() . We calculate the
. We calculate the ![]() curve as a function
of the number of server nodes for the four protocols under the
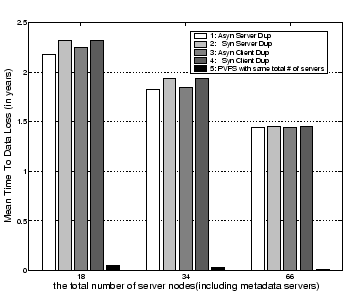
three server configurations. Figure 15
compares the reliability between CEFT-PVFS and PVFS and
Compared with
their
curve as a function
of the number of server nodes for the four protocols under the
three server configurations. Figure 15
compares the reliability between CEFT-PVFS and PVFS and
Compared with
their ![]() , on the average the four duplication protocols
improve the reliability of PVFS by a factor of 41, 64 and 96 in
the three server configurations, respectively. In addition,
Protocol 1 is
, on the average the four duplication protocols
improve the reliability of PVFS by a factor of 41, 64 and 96 in
the three server configurations, respectively. In addition,
Protocol 1 is ![]() ,
, ![]() and
and ![]() of Protocol 2 and 4 under
the three different server configurations, respectively, with an
average degradation of
of Protocol 2 and 4 under
the three different server configurations, respectively, with an
average degradation of ![]() . Protocol 3 is
. Protocol 3 is ![]() ,
, ![]() and
and
![]() of Protocol 2 and 4, with an average degradation of
of Protocol 2 and 4, with an average degradation of
![]() .
.