| (12) |
The total amount of time expected before being absorbed into the data loss state is equal
to the total amount of time it expects to make to all the non-absorbing states.
Since the system starts from State 1, where there are no node failures,
MTTDL is the sum of the average time spent on all states ![]() , (
, (
![]() ), i.e.,
), i.e.,
 |
(13) |
When ![]() and
and
![]() ,
our model becomes the classic model for RAID-1. If
,
our model becomes the classic model for RAID-1. If
![]() and
and
![]() ,
it then becomes the classic model for RAID-0. When using the same
,
it then becomes the classic model for RAID-0. When using the same
![]() and
and ![]() to calculate the
to calculate the ![]() of RAID-0 and RAID-1 as Ref. [28],
our model shows identical results to those given in the above references.
of RAID-0 and RAID-1 as Ref. [28],
our model shows identical results to those given in the above references.
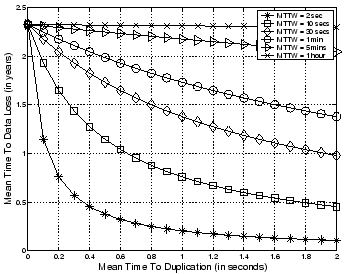
To further validate our model, Figure 14 shows
the relationship between ![]() and
and ![]() under different
workload conditions in an CEFT-PVFS where there are 8 data server
nodes in either group. The
under different
workload conditions in an CEFT-PVFS where there are 8 data server
nodes in either group. The ![]() in this figure is calculated
based on our model built above. This figure indicates that the
in this figure is calculated
based on our model built above. This figure indicates that the
![]() decreases with an increase in
decreases with an increase in ![]() . With the same
. With the same ![]() but increasing
but increasing ![]() ,
, ![]() increases. All of these
performance trends are intuitive and realistic.
increases. All of these
performance trends are intuitive and realistic.